| No matching records found | |
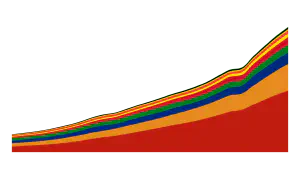
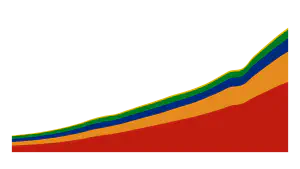
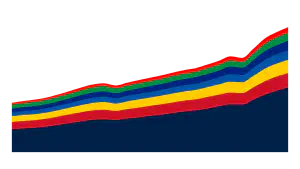
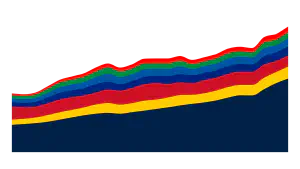
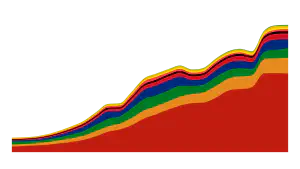
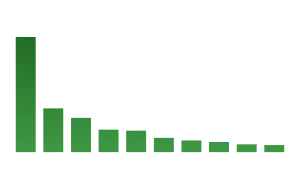
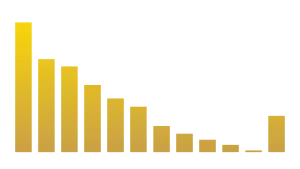
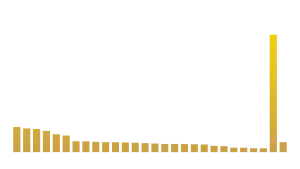
BRICS Gross Domestic Product (GDP)
Upd:
The main goal of the Glostat project is to rely on primary sources to support the work presented (white papers, government data, original reporting, etc.). However, when relevant, we may also cite original research from other credible publishers.
BRICS Gross Domestic Product (GDP):
Origin
World Bank
Name World Bank IndicatorsCountryLanguageEnglish
Released Retrieved AttributionThis data is used under the terms of the CC-BY 4.0. Changes: Numbers were rounded to the nearest billion.
Origin
International Monetary Fund
Name GDP, current pricesCountryOrganisationLanguageEnglish
Released Retrieved Part of
More from
GDP